Site
The 2020 Needs Assessment is an interactive resource, allowing users to click through information in ways not possible in a print format. It is separated into the following sections:
The 2020 Needs Assessment is an interactive resource, allowing users to click through information in ways not possible in a print format. It is separated into the following sections:

These sections explain the background of the 2020 Needs Assessment.
You are here now.
This page was created to help users understand the layout and features of the 2020 Needs Assessment.
– Statistical & Spatial section
The State of Greenwich has six major themes and interactive dashboards displaying information relevant to community agencies, non-profit organizations, and residents.
The Special Topics section focuses on two issues – Equality and Affordable Housing – that emerged as important from surveys and interviews with Greenwich community members. The special topics are brief and concise.
Here you will find a printable and/or downloadable PDF of the 2020 Needs Assessment Executive Summary.
Hover your cursor around the dashboards to experience the interactive functions. Using the cursor, you can click on any of the sub-themes to see each breakdown, apply filters, highlight specific needs, and convert between tables and graphs to obtain real-time visuals. There are also options to share and download the dashboards.
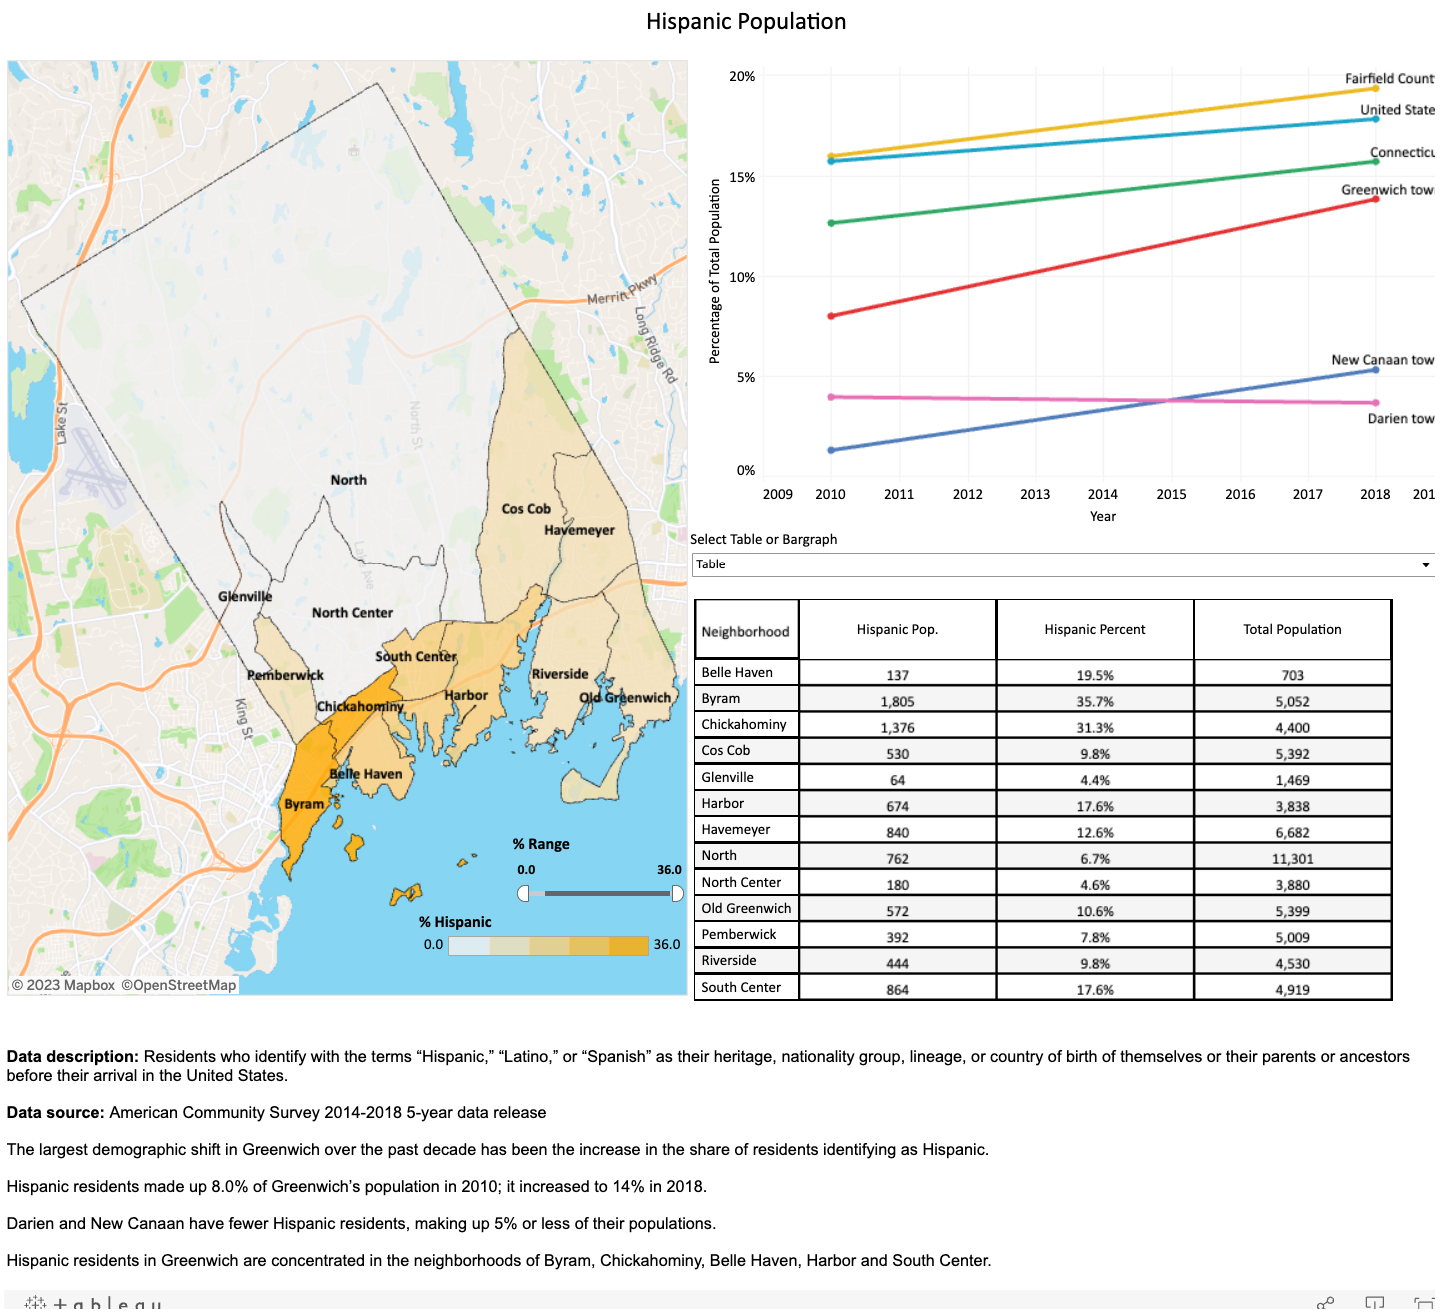
In some cases, you will need to use the full screen option to see the full dashboard. The typical dashboard fits the following format:

Clockwise, you can see the following elements:
The map shows thematic visualization of the Greenwich community and neighborhoods with features that allow you to filter based on the variable range and click on neighborhoods to view their specific information.
This chart is formatted as a time series (line graph) or a snapshot (bar graph) dependent on data availability. This is done to see how Greenwich compares to its peer communities and other geographical areas such as Fairfield County and the State of Connecticut.
The neighborhood level statistics are the most important aspect of the 2020 Needs Assessment allowing users to look at localized statistics for the thirteen Greenwich neighborhoods instead of town-wide aggregations. You will find the base for variable calculations, the percentage of residents or households that meet the criteria, and percentages.
Here you will find the data description and source for each dashboard as well as key takeaways from the Fairfield University research team.

These buttons allow you to share, download, or view the Tableau Public page of the dashboard.
Stay up to date with news and events from Greenwich United Way.