Greenwich Neighborhoods
Greenwich is a community of well-established neighborhoods from Byram, Belle Haven, Riverside and Old Greenwich on Long Island Sound to Glenville, the business district on Route 1 and Greenwich Ave., to the area north of the Merritt Parkway. The RTM (Representative Town Meeting) districts are organized on a neighborhood basis. A major component of the 2020 Needs Assessment is a focus on these neighborhoods to analyze census and other data at the neighborhood level.
The US Census Bureau has established spatial boundaries for the entire country that reflect the differing demographics of the country at small geographical areas. Across the country there are 211,267 block groups, 2,585 in Connecticut and 60 in Greenwich. The boundaries for almost all of Greenwich’s 60 block groups are completely within one RTM district. Belle Haven is one block group and in the NA2020 is defined as a separate neighborhood. The Pemberwick/ Glenville RTM district includes two neighborhoods that are organized as separate neighborhoods in the NA2020.
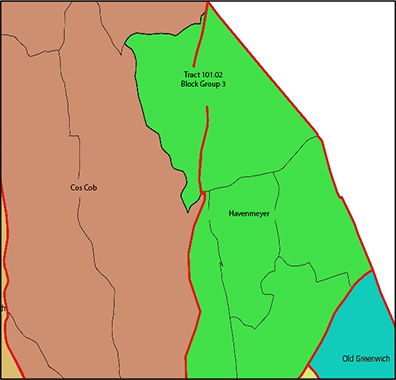
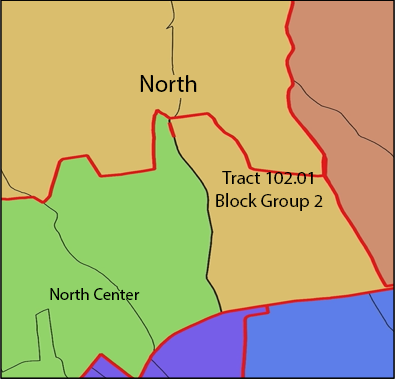
In a few cases, a block group was divided between two RTM districts and allocated to one. For example, as Figure 2 shows, block group 101.02 3 is in both Cos Cob and Havemeyer with the larger area in Havemeyer; thus, this block group was allocated to Havemeyer in the NA2020. For Block Group 102.01 2, the largest area is in North and a small portion in North Center; this block group was allocated to the North neighborhood in the NA2020.
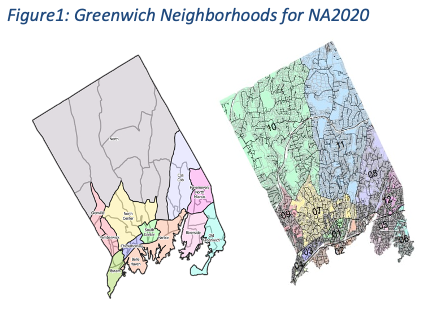
In total, we identified 13 neighborhoods, illustrated in Figure 1, based on town RTM districts and census block boundaries.
The Census Bureau has built block group spatial files for GIS analysis that were combined to create a GIS map of the 13 neighborhoods. For all 60 block groups assigned to the 13 neighborhoods, the American Community Survey data, and the US Census Bureau’s most recent data, was aggregated to the neighborhood level to explore and analyze variables important to the NA2020.
Asset Mapping
To understand what and where human services exist within Greenwich, the research team accessed United Way of Connecticut’s 2-1-1 program. United Way 211 is a comprehensive source of local social services from disaster assistance and crisis management to basic needs and curated service provider information. Visualizations were developed to map the location and details of services and providers.
Survey
A community survey was a key component of NA2020. Survey results provided guiding perspectives from people living and/or working in Greenwich. The survey was self-administered online. Respondents were recruited through a direct mailing to every registered residential address in Greenwich, physical and digital media advertising, and emails to Greenwich United Way partners and contacts. The survey launched February 11, 2020 with the expectation of collecting data over 12 weeks. However, the outbreak of COVID-19 prevented in-person recruitment efforts. Given the impact of the pandemic on the entire human services landscape, including on people ’s perceptions of service needs, data collection was ended on March 13, 2020, earlier than expected. During the data collection period, 725 people provided responses to the survey. Their responses provided critical insights into how the people of Greenwich viewed the service needs in town and informed the interviews that followed to address both pandemic and pre-pandemic contexts.
Interviews
Thirty-three interviews were conducted using a semi-structured protocol designed to allow inquiry to be uniquely shaped based on each participant’s responses while maintaining structural alignment with core elements of NA2020. The interviews elicited a qualitative overview of community members’ varied perspectives on human service priorities and challenges in Greenwich and created opportunities to engage with and document the narratives of individual community leaders across sectors, including local government, social services, education, and non-profits. Interviews typically lasted 30 minutes, and most were completed during the summer months via video-conferencing. Additional group interviews with seniors participating in River House virtual programs and with high school-age youth leaders rounded out qualitative data collection.
Dashboard & Reporting
An important addition to NA2020 is an interactive data dashboard designed to visually display results and allow users to search and download specific information. The dashboard will be updated on a periodic basis.


